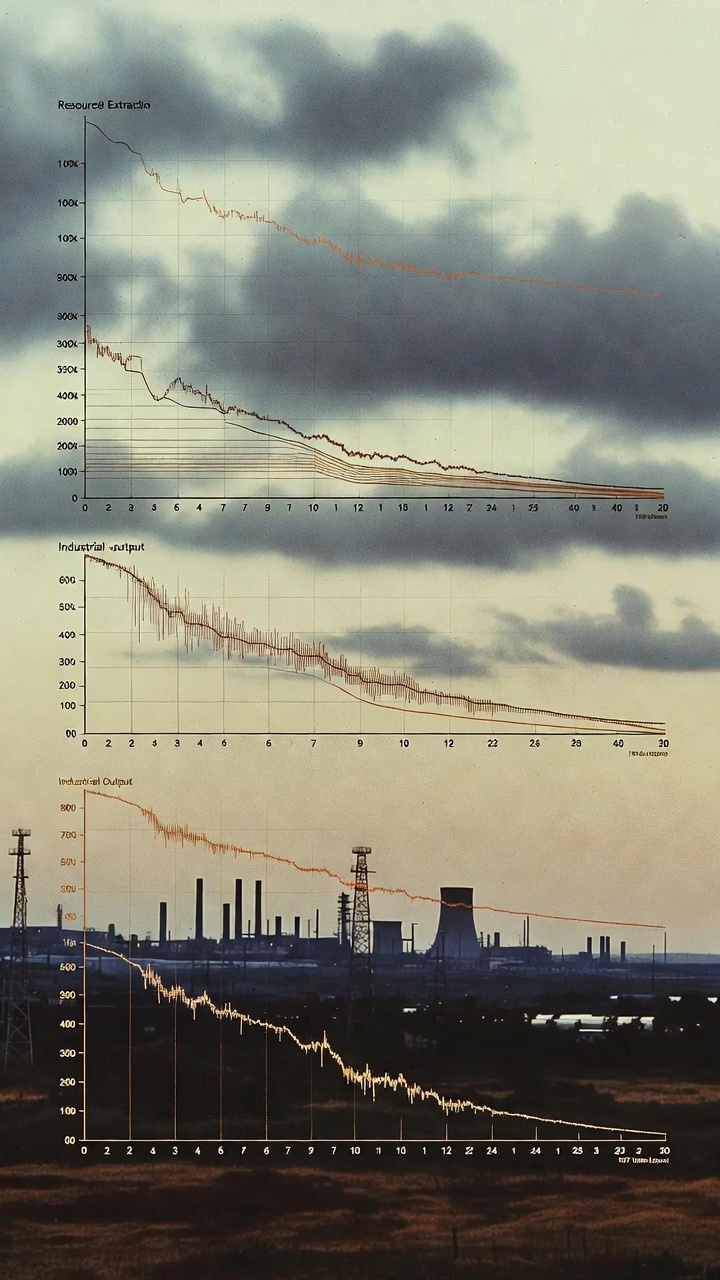
The 1972 MIT study titled The Limits to Growth has resurfaced in online discussions with claims that it accurately foresaw the end of industrial civilization around 2040. The report, produced by a team at MIT for the Club of Rome, used one of the earliest large-scale computer models of global systems to explore interactions between population, industrial output, food production, non-renewable resources, and pollution. Under its baseline “business as usual” assumptions, the model generated scenarios in which exponential growth eventually collided with finite planetary limits, producing overshoot followed by sharp declines in living standards and population support capacity during the first half of the twenty-first century.
Those graphs have circulated again because recent quantitative comparisons of real-world data against the original projections show uncomfortable similarities in several variables. At the same time, the study’s proposed pathways out of trouble—particularly the “stabilized world” scenario that assumed coordinated global policy shifts—have drawn renewed scrutiny for their reliance on assumptions about governance and human behavior that history has repeatedly tested and found fragile.
This article examines the original modeling exercise, the empirical updates that have tested it, the variables the 1972 framework handled less convincingly, and the practical difficulties that arise when models move from description to prescription. The goal is not to declare a verdict of inevitable collapse or confident salvation, but to clarify what the documented projections actually stated, where observed trends track or diverge from them, and what that implies for assessments of systemic risk.
The 1972 World3 Model and Its Core Assumptions
The Club of Rome commissioned the work after a series of meetings that identified “the predicament of mankind” as the collision between rising material demands and the physical constraints of a single planet. Researchers Donella Meadows, Dennis Meadows, Jørgen Randers, and William Behrens III built World3, a system-dynamics model that treated the global economy and environment as interconnected stocks and flows rather than isolated sectors. Five main variables interacted through dozens of feedback loops: population, industrial capital, non-renewable resources, agricultural output, and persistent pollution.
The model did not assume static technology or fixed consumption patterns. Instead, it incorporated relationships observed in the historical record up to the late 1960s and early 1970s—rising resource extraction costs as high-grade deposits were depleted, increasing capital requirements for pollution control, and fertility responses to rising income and urbanization.The team ran multiple scenarios.
The baseline “business as usual” run kept policy and technological change close to the trends of the preceding decades. Other runs tested the effects of accelerated technological progress in resource efficiency or pollution abatement, or deliberate policies to stabilize population and material throughput. One variant produced a “stabilized world” in which industrial output and population leveled off at high but sustainable levels after deliberate shifts in priorities and investment.Collapse in the model did not mean the sudden disappearance of humanity. It meant a rapid contraction in industrial output per capita, food availability, and services once capital was increasingly diverted to extracting scarcer resources or mitigating accumulating pollution. Population would eventually follow downward as mortality rose from reduced welfare. The timing in the baseline run placed the most severe phase of decline in the 2030–2050 window.
How Later Data Comparisons Have Tested the Projections
Independent researchers have periodically compared actual statistics against the original scenarios. Graham Turner’s work at the University of Melbourne in the 2000s and 2010s found that observed trends in industrial output, resource use, and pollution tracked the business-as-usual path more closely than the technology-optimistic or stabilized alternatives. A more recent and granular update came from Gaya Herrington, then at KPMG, who published a detailed comparison in the Journal of Industrial Ecology in 2021 using data through 2019–2020. Her analysis tested four of the original scenarios against empirical proxies for population, industrial output per capita, food per capita, services, pollution (using CO₂ and plastic production as indicators), and non-renewable resource depletion.The data aligned most closely with two scenarios: one labeled BAU2, which produced pollution-driven collapse, and a “comprehensive technology” variant that showed significant but non-catastrophic declines. Both indicated that the long upward trend in key welfare indicators would flatten or reverse within roughly a decade from the data endpoint—placing the inflection around the early 2030s. The pure baseline business-as-usual run from 1972 was no longer the closest match, yet the broad direction of overshoot remained visible.
A subsequent recalibration of World3 parameters with data through 2022 produced similar overshoot-and-decline dynamics in the coming decade.These comparisons do not prove the model “correct” in every detail. They show that several core relationships—rising costs of extraction, accumulating pollution burdens, and the diversion of capital away from net growth—have manifested in directions the 1972 equations anticipated under continued growth-oriented policies.
Demographic and Technological Factors the Original Model Treated Lightly
One variable the 1972 team could not fully anticipate was the speed and breadth of fertility decline. The model incorporated a relationship in which rising industrial output and urbanization eventually reduced desired family size, but the pace was calibrated to 1960s–1970s experience. Global total fertility has since fallen faster and across more regions than many demographers of that era expected. Several major economies now sit well below replacement level, and the global average continues to drop.
Lower fertility produces smaller future cohorts of workers and consumers. That shift can ease pressure on resources and pollution in the long run, yet it also creates near-term headwinds for economic growth through aging populations, shrinking labor forces, and rising dependency ratios. These dynamics were not absent from the model, but their speed and geographic spread were underestimated. A world that reaches peak population earlier and then contracts through low births rather than through rising mortality follows a different trajectory from the one in which collapse itself drives the downturn.
Technological change presents a parallel complication. The stabilized-world scenario assumed substantial advances in resource productivity and pollution control, but only in combination with policy choices that redirected investment away from perpetual material expansion. Standalone technological progress under business-as-usual incentives has delivered efficiency gains in many sectors—renewable energy costs, agricultural yields per hectare, and emissions intensity in some industries—but these gains have often been offset by increased overall consumption (the rebound effect). The model captured some of these trade-offs in its feedback structure, yet it could not incorporate technologies that did not yet exist at scale, such as widespread precision agriculture, advanced recycling systems, or the current generation of AI-assisted resource management.
The Stabilized-World Scenario and the Governance Problem
The scenario that avoided collapse in the original runs required more than technology. It assumed a deliberate, coordinated shift in societal priorities toward sufficiency, reduced material throughput, and more equitable distribution of output. In practice, this implied forms of global or regional governance capable of enforcing limits on aggregate consumption and redirecting capital at scale.
Historical attempts to impose centralized allocation of resources and production quotas have repeatedly encountered the same obstacles: misaligned incentives, information problems, rent-seeking, and resistance from populations that value autonomy and local knowledge. The video discussion that prompted this analysis correctly noted that ambitious top-down frameworks often underestimate these frictions. Venezuela’s experience with centralized economic management, or earlier large-scale planning experiments, illustrates how quickly production and distribution systems can degrade when price signals and individual initiative are heavily suppressed.
Even well-intentioned international coordination faces sovereignty constraints and enforcement gaps. Pollution control agreements have achieved measurable results in specific domains (stratospheric ozone, certain air pollutants in OECD countries), yet broader efforts to cap aggregate resource use or redirect global investment have produced more declarations than binding, verifiable shifts in trajectory. Models that treat governance capacity as adjustable by assumption risk understating the political and institutional capital required to implement their preferred outcomes.
INSIGHT: Primary Sources and Further Analysis
The original Limits to Growth report remains available through academic archives and institutional repositories. A digitized version can be accessed via the Internet Archive or institutional collections linked from the Club of Rome site.Gaya Herrington’s 2021 update, “Update to limits to growth: Comparing the World3 model with empirical data,” was published in the Journal of Industrial Ecology and is accessible through Wiley Online Library or the KPMG advisory archive.
It supplies the most recent systematic data comparison and includes detailed variable-by-variable assessments.Earlier empirical checks by Graham Turner (University of Melbourne) provide additional reference points for the period up to the mid-2010s. The 2004 thirty-year update book by the original authors extends the modeling with revised parameters and new scenarios.
These sources matter because they move the discussion from anecdote or selective graph circulation to documented model structure and observable data series. They also reveal where the 1972 framework was silent or under-specified—particularly on the pace of demographic transition and on the institutional requirements of any stabilized pathway. Readers interested in systemic risk assessment will find the quantitative comparisons more useful than viral summaries that either dismiss the work outright or treat it as infallible prophecy.